The share of Indian economic output was around one-third of the total global GDP in 1 CE (1 AD). India’s share in global GDP was largest in those times. For over 1500 years, the Indian economy dominated the world economy, trade, and commerce.
Why should we be concerned about such old data and figures in this modern world? We learn history to understand what happened in the past. History tells us what went right and what mistakes we made as a nation. Understanding these things, we become aware of mistakes that our ancestors made, so we do not repeat those same mistakes. It also fills us with pride when we know our great history regarding our economic supremacy all over the world. We get confident by knowing what we were and what we can be.
History—India’s Share in Global GDP
India is a country with a huge time span of history; it is one of the oldest civilizations in the world. The country with a great history and prosperous economy was known as ‘sone ki chidiya‘ (golden bird/sparrow).
The share in global GDP was around 32% in 1 CE (1 AD), the largest economy of those times. For over 1000 years the Indian dominated the world economy. The dominance continued until the Mughal era, and in the later Mughal period, it started declining. British colonization of India made India a supplier of raw materials, which used to be a manufacturing hub. Colonization did the most harm to the Indian economy. The Indian economy faced its lowest point in the British period. Now, the Indian economy is rising again with a fast growth rate.
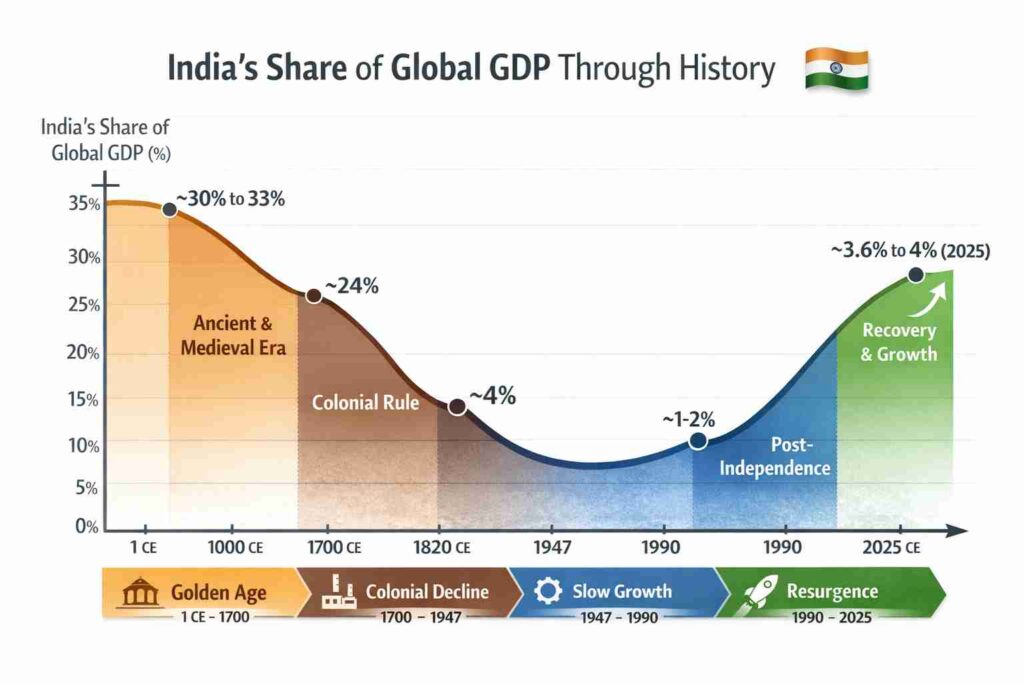
U-shaped recovery 📈
The economic history of India can be illustrated as a U-shaped curve on a graph. In the U-shaped graph, the highest point of the economy was in ancient and medieval times, and the lowest was in the British colonial period. The economy is now in a rapid recovery phase that will create another highest point in terms of global GDP share.
Source = Govt. of India document
| Year | Estimated Share of World GDP | Key Economic Context |
| 1 AD | ~32% | Largest economy; major exporter of textiles and spices to Rome. |
| 1000 AD | ~28% | Continued dominance during the early Medieval period. |
| 1500 AD | ~24% | Pre-Mughal era: prosperous trade via the Silk Route/Road and Indian Ocean. |
| 1700 AD | ~24% | The Mughal period: India was the world’s primary manufacturing hub. |
| 1820 AD | ~16% | Early British East India Company rule; deindustrialization started. |
| 1900 AD | ~7% to 9% | Shift from a manufacturing hub to a source of raw materials. |
| 1950 AD | ~4% | At independence, one of the world’s poorest nations. |
| 2025 AD | ~9.5% (PPP) | Currently the 4th largest economy (nominal) and 3rd in PPP (2025-26). |
The Story of India and Its Economy👇
Ancient times – India’s Share in Global GDP [1 AD to 750 AD approx.]
The Indian subcontinent was ruled by multiple kingdoms in ancient times. The major kingdoms were the Kushanas, the Gupta Empire, the Pushyabhuti dynasty, the Satvahanas, the Chalukyas, the Pallavas, and the Chola, Chera, and Pandyas, etc.
The GDP of India in 1 CE (1 AD) was around 32% to 33% of the world’s total GDP. The Indian subcontinent was the single largest economy in the world.
- The primary economic activities were –
- agriculture 🫚🌶️🍇🍉, crafts 👚💎💍📿🧣 and other manufacturing activities, and trade 👑🪙 and commerce ⛵🚢⚓.
- Financial activities were also common in those times. Use of financial instruments like Hundis (trade bills) was popular.
- The Indian economy was the largest economy in the world. The trade relations were with the Roman Empire, China, and other regions of the world.
The source of information is a widely considered source, which is British historian Angus Maddison’s history. The second source is Wikipedia, which is again a popular and widely trusted source.
Medieval times – India’s share in global GDP [750 AD to 1700 AD approx.]
Post-Pushyabhuti dynasty (the reign of King Harshvardhan ended), the medieval period began in India. The Indian subcontinent was under the rule of multiple kingdoms. Trade, commerce, and other economic activities were at their peak.
The dynasties that reigned – Gurjar Pratihar, Chauhans, Chandela, Chola, Chera, Pandyas, Chalukya, etc. Khilji, Lodi, Tughlaqs, Mughals, etc.
The share of the Indian economy in global GDP was around 28% to 24%. The Indian subcontinent continued its dominance over the global economy. Until the pre-colonial era (until 1700 AD), the share of India’s economy in global GDP was approximately 22% to 24% of the total world GDP.
- The economic activities –
- The economic activities remained the same as in ancient times. Agriculture, forestry, and natural resource extraction were the base for other economic activities.
- Trade and commerce flourished, and the trade links became stronger with neighboring regions. The Silk Route and trade through ocean routes became more prominent.
- The early financial system became more developed. Banking operations were part of normal life.

Colonial Era (1700 to 1947)
The British colonization of India did much harm to the economy and wealth of the nation. In the times of industrialization, many handicraft industries got closed. Industrialization accelerated in Europe and Britain. This resulted in deindustrialization in many regions. The British imposed taxes on Indian domestic products at high rates. They levied taxes on very basic things like salt. The taxes made Indian products costlier and unaffordable in comparison to the cheap, machine-made goods.
India’s share in global GDP declined dramatically during this period. The share of India’s economy fell to 16% in the early 19th century. The economic decline continued, and in the early 20th century it fell drastically to just ~7% of the total world GDP. At the time of independence, our share in global GDP was around 3% only. India was among the poorest nations in the world at the time of independence.
The British plundered India, with the estimated monetary value of this plunder being around 45 trillion USD at present values. This research is cited by Utsa Patnaik, a well-known Indian economist, who emphasized the significance of the wealth the British extracted from India.
If you are not getting the figures of how much the Britishers looted, then just compare our current GDP figures with that looted money. Our GDP in January 2026 is 4.1 trillion USD, and the GDP of the UK (Britain) is around 3.9 trillion USD.
Post-independence India
After the independence, our growth was slow for obvious reasons. It was a time of recovery and stagnant growth. From 1947 to 1991, the share of India’s economic output in the global economy remained around 3% to 3.5%. We fought issues like food security, poverty, health, sanitation, etc. We were at war with our neighboring countries like Pakistan and China.
1991 – liberalization of the economy
In 1991, the Indian economy underwent significant reforms. In the era of globalization, the Indian economy opened for foreign industries and foreign investment. Trade liberalization of the Indian economy began. The move accelerated the growth of the Indian economy dramatically.
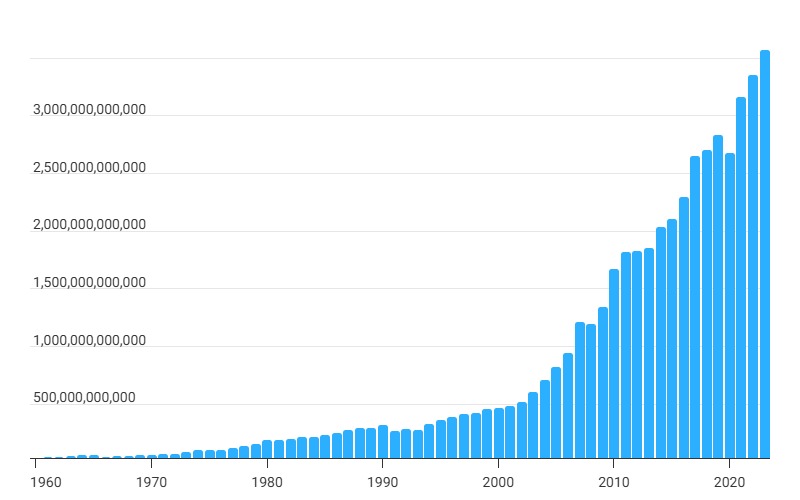
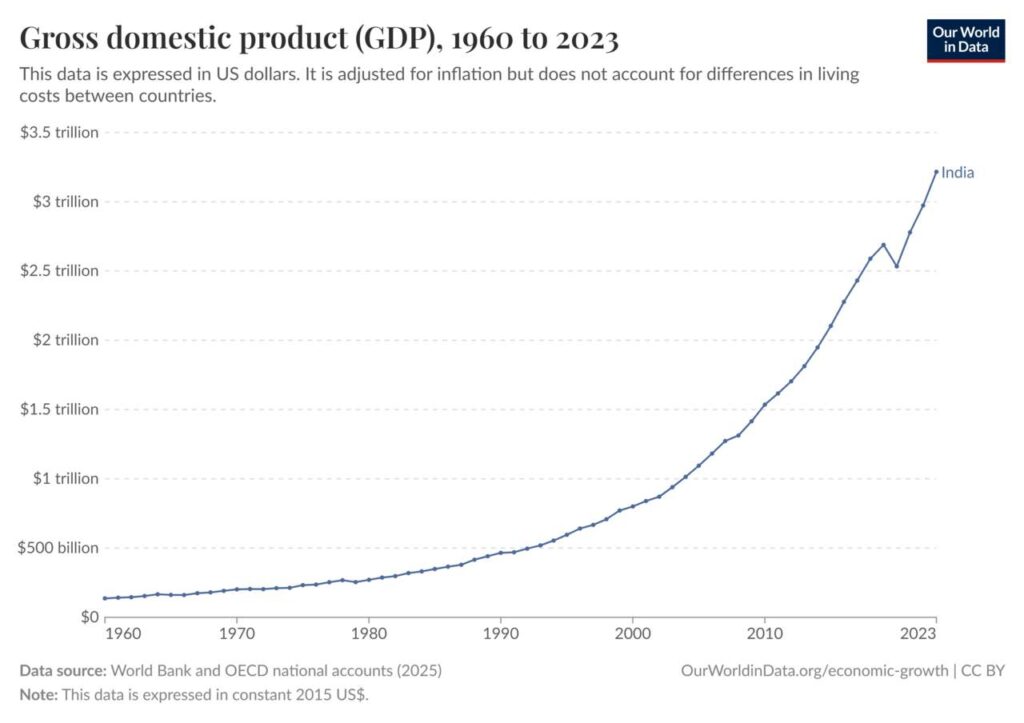
Our economy hit the 1 trillion USD mark in 2007, and it took almost 60 years to make our economy a trillion-dollar economy (GDP reached 1 trillion USD). The next 1 trillion was added to the GDP in only 7 years! Now India is the 4th largest economy in the world (January 2026) with a GDP of ~4.2 trillion USD. Now, India’s GDP contribution to world GDP is around 3.5% to 4% (nominal GDP) and 8% (GDP at PPP).
By 2030, India will be the 3rd largest economy in the world. This is called a U-shaped recovery, and India will definitely achieve its former glory.